
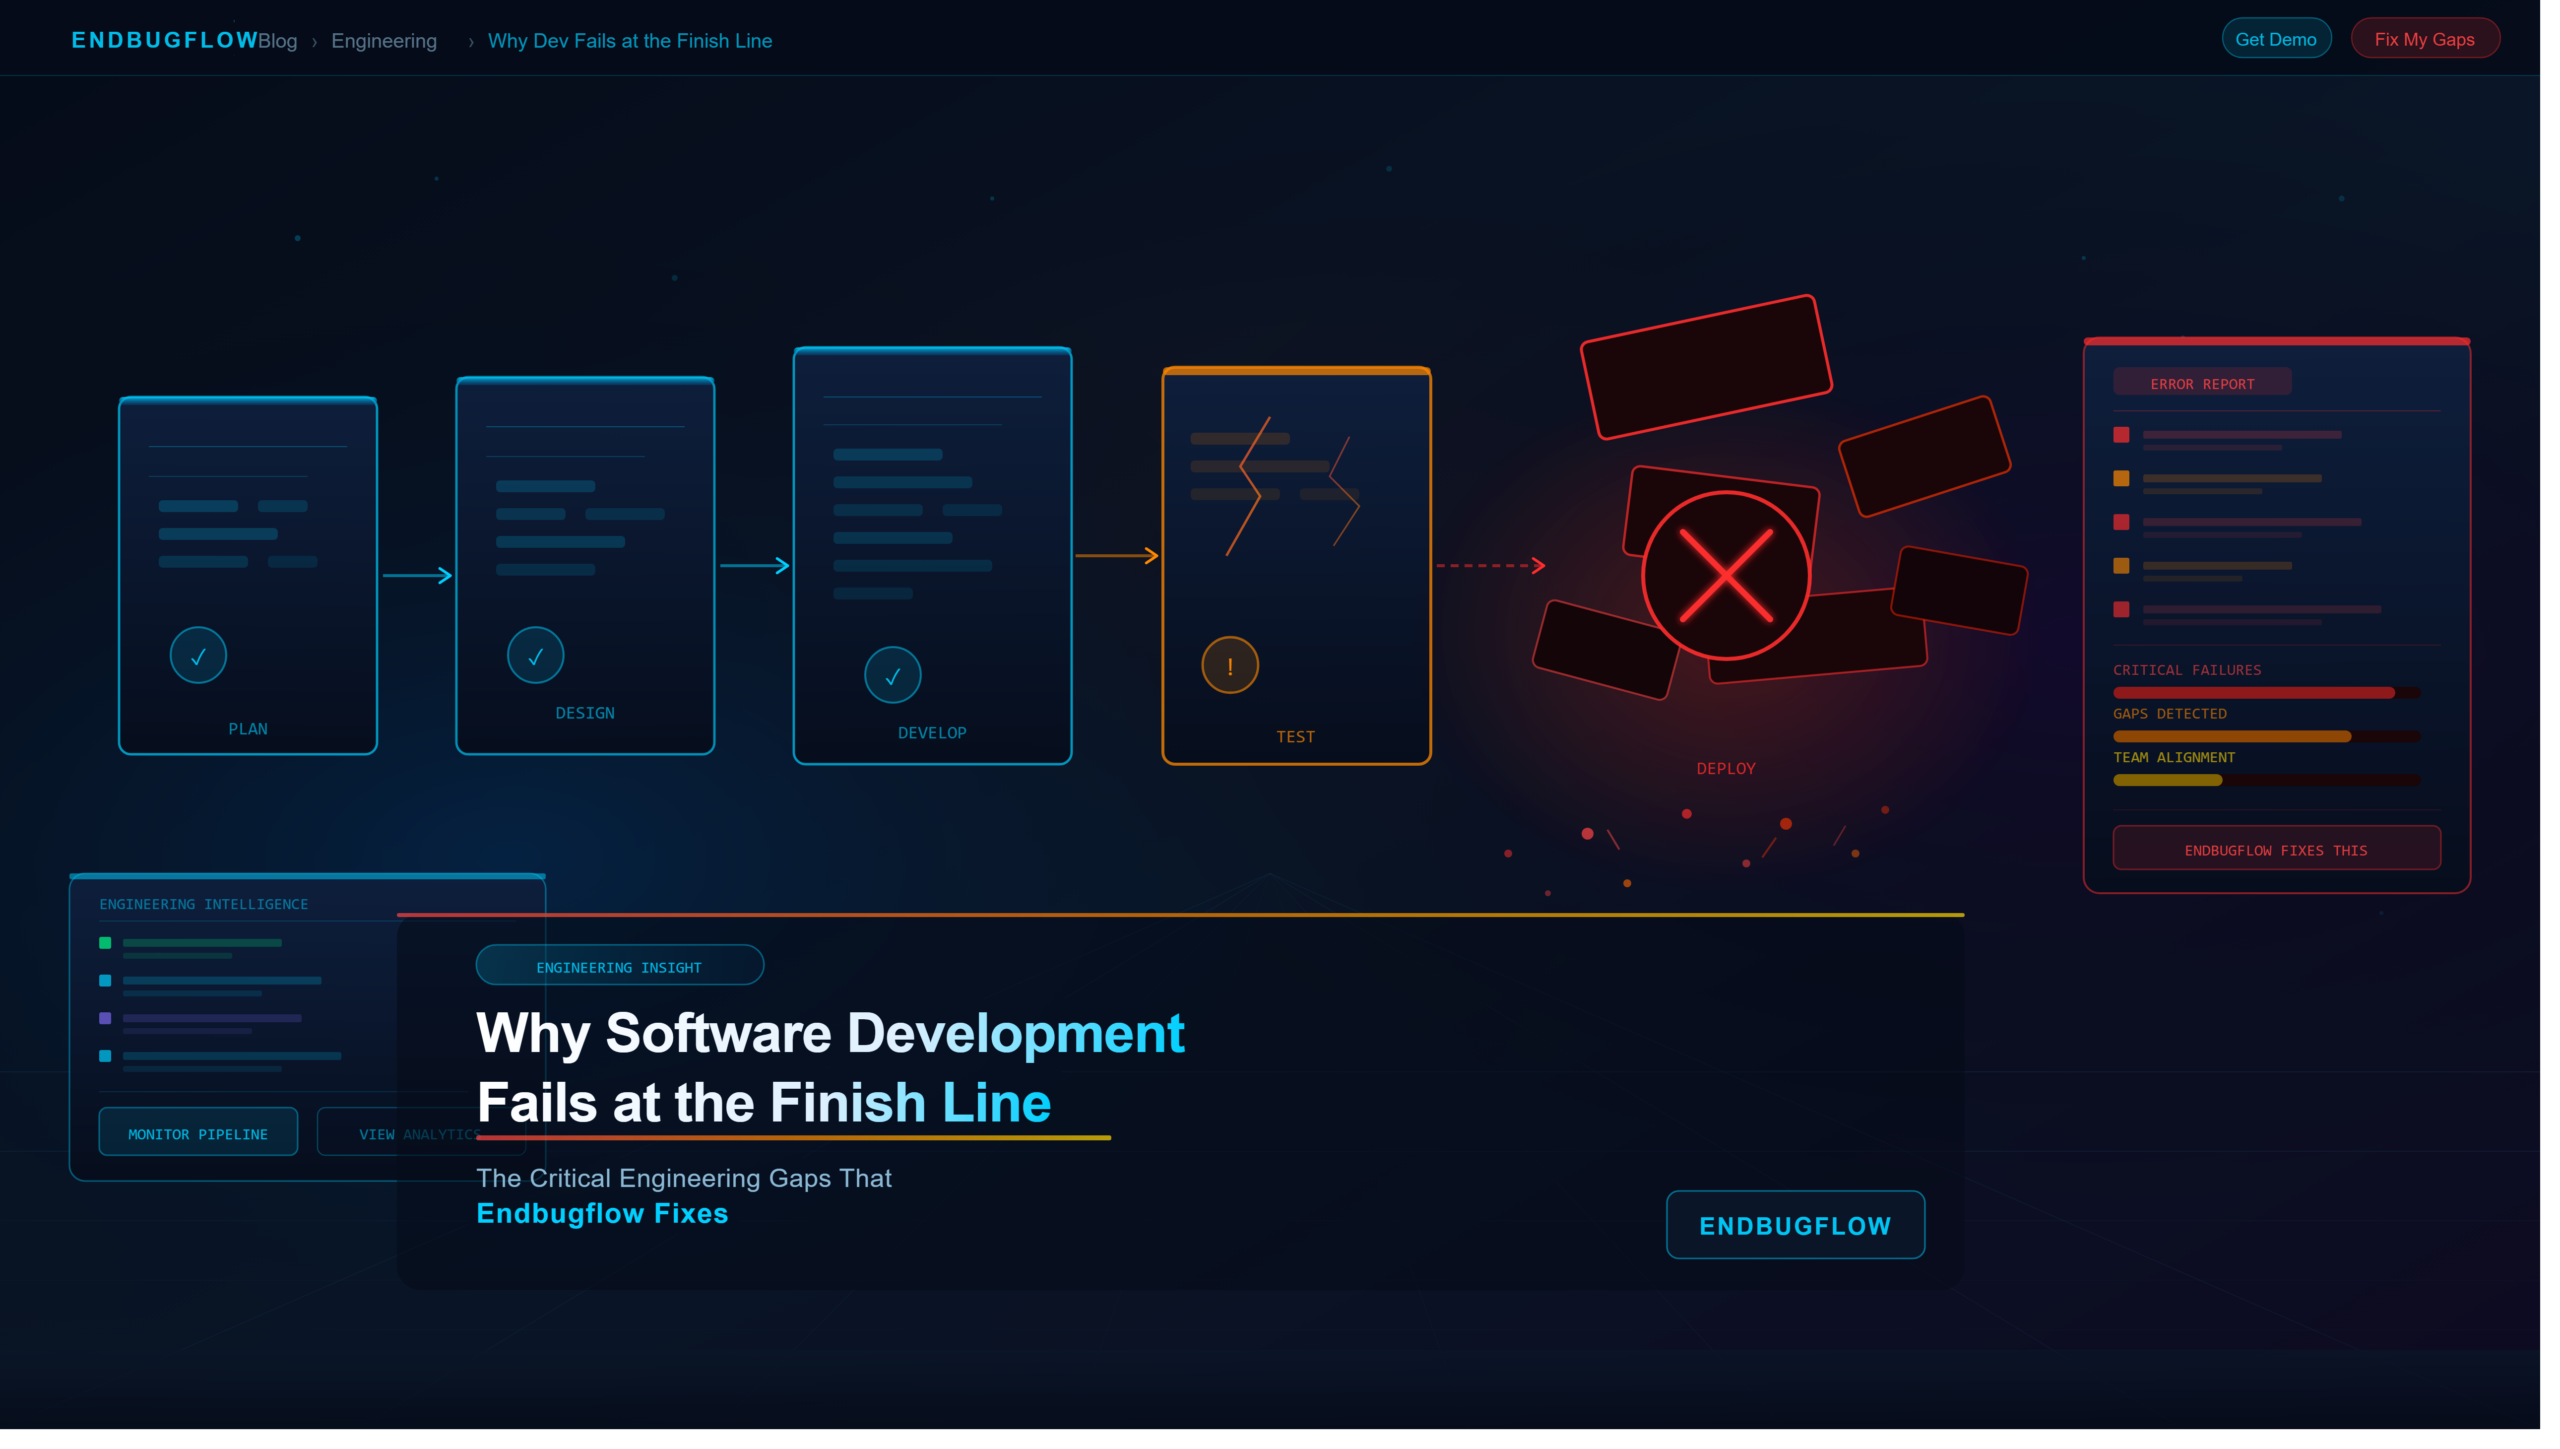
The final ten percent of any software development lifecycle is notoriously deceptive. A engineering team can spend six months meticulously drafting architecture, sprint planning, and writing clean, modular code. The builds pass in the local environments. The staging area looks pristine. Yet, the moment the application hits the friction of real-world deployment, everything changes.
Unanticipated edge cases surface. Asynchronous race conditions choke the database. API rate limits flip like tripwires, and third-party dependencies throw undocumented errors. This chaotic intersection of late-stage debugging, deployment friction, and post-release stabilization is what engineers call the “tail-end bug pipeline”—or more simply, the bottleneck where profitability goes to die.
When code maintenance stalls at this exact juncture, it triggers a costly operational loop:
-
Context switching destroys developer velocity as engineers jump between building new features and patching production fires.
-
Telemetry gaps force QA teams to guess why a failure occurred rather than executing a precise fix.
-
Product delivery timelines slip, eroding stakeholder trust and exhausting engineering budgets.
Resolving this systemic issue requires moving away from reactive patching. True operational efficiency demands a deliberate framework that unifies error isolation, environment parity, and semantic debugging into a single continuous process.
This analysis examines the mechanics of optimizing this final phase of development, exploring how engineering teams dismantle debugging bottlenecks, systematically isolate complex defects, and leverage modern systems like Endbugflow to safeguard their deployment pipelines.
The Hidden Anatomy of Late-Stage Software Defects
To fix a broken development pipeline, we must first understand why bugs cluster so heavily near the end of the release cycle. It is rarely a reflection of developer competence. Instead, it is a structural consequence of how software systems scale and interact.
The Illusion of Clean Code in Isolation
During early development sprints, code exists in a controlled ecosystem. Mock servers simulate external APIs, database seeds are small and predictable, and user behavior is perfectly rational.
As the software nears production readiness, these synthetic safety nets are stripped away. The code must suddenly contend with:
-
Distributed State Fractures: In modern microservices or decoupled frontend-backend architectures, state is rarely centralized. A delay in a single upstream webhook can cause downstream components to render data out of sequence, producing intermittent failures that defy simple unit tests.
-
Silent Failures and Swallowed Exceptions: Not all bugs trigger a crashing stack trace. The most destructive defects are silent—a try-catch block that swallows a critical network error, or an automated retry mechanism that gradually starves the system’s memory pool until the entire server restarts without warning.
-
The Telemetry Black Box: When a bug occurs in production, standard logs often say what happened (
500 Internal Server Error) but completely obscure why it happened. Without deep contextual snapshots of the application state at the exact millisecond of failure, developers are left parsing ambiguous stack traces.
The Financial and Psychological Toll of Debugging Debt
Every hour a senior engineer spends hunting a phantom bug in a staging environment is an hour stolen from product innovation. The costs compounding behind these inefficiencies are steep:
| Operational Metric | Reactive Debugging Approach | Optimized Flow Isolation |
| Mean Time to Detection (MTTD) | Hours to days, often reliant on user complaints. | Near-instantaneous via real-time telemetry. |
| Mean Time to Resolution (MTTR) | High; requires manual replication and local log hunting. | Low; automated state capture isolates the root cause immediately. |
| Developer Attrition Risk | High; burn-out from continuous, chaotic firefighting. | Low; structured, predictable resolution paths. |
| Sprint Predictability | Volatile; late-stage blockers routinely derail product launches. | Stable; edge cases are caught and categorized systematically. |
Demystifying Endbugflow: A Paradigm Shift in Error Architecture
To navigate out of this cycle of reactive firefighting, engineering teams are adopting structured frameworks designed to manage the end-to-end lifecycle of a defect. This methodology is often codified into a unified technical philosophy: Endbugflow.
At its core, an optimized Endbugflow strategy isn’t merely about installing a basic error tracker or configuring another alert on a Slack channel. It represents an intentional, end-to-end architectural pipeline that automates the isolation, contextualization, and elimination of software defects at the boundary of deployment.
Automated State Capture (The Digital Flight Recorder)
Traditional log files are linear records of text. They show a timeline of events, but they lack depth. A modern Endbugflow implementation operates like a commercial airliner’s flight data recorder.
When an anomaly or unhandled exception occurs, the system captures a comprehensive cryptographic snapshot of the runtime environment. This includes local variable values, active memory allocations, pending asynchronous operations, and the exact sequence of user actions leading up to the breach. Instead of trying to recreate the crime scene, developers are handed a complete interactive recording of it.
Environment Parity and Behavioral Mapping
Bugs thrive in the discrepancies between a developer’s local laptop and an enterprise cloud cluster. An effective bug flow methodology uses sophisticated environmental mapping to track how code executes across differing infrastructures.
By analyzing telemetry across local, staging, canary, and production environments simultaneously, the system pinpoints whether a bug is born from raw source code errors or infrastructure misconfigurations, such as mismatched environment variables or silent network time-outs.
Smart Deduplication and Contextual Grouping
One root-cause database timeout can trigger ten thousand individual error alerts across a microservice cluster within minutes. This creates “alert fatigue,” a dangerous condition where engineers mute notifications because the signal-to-noise ratio is too low.
An intelligent Endbugflow system uses structural clustering algorithms to parse incoming telemetry. It recognizes that thousands of distinct alerts are actually symptoms of a single upstream failure, grouping them into a unified incident report that prevents team communication channels from becoming overwhelmed.
Step-by-Step Blueprint: Building an Unshakeable Defect Isolation Pipeline
Transitioning your engineering organization to a highly efficient bug workflow requires combining architectural shifts with cultural adjustments. Here is a practical framework for implementing a robust error isolation engine within your current development pipelines.
Establish Deep Telemetry at the Component Level
Do not wait for end-to-end integration tests to observe system behavior. Embed structured logging and exception handling boundaries directly into your foundational services.
-
Implement Explicit Error Boundaries: In frontend architectures (like React or Vue), wrap logical components in error boundaries to prevent a localized UI glitch from crashing the entire browser session. In backend architectures, use middleware to intercept unhandled rejections before they terminate the runtime process.
-
Inject Correlated Tracing IDs: Every incoming user request should be assigned a unique, immutable Correlation ID at the API gateway level. Pass this ID downstream through every microservice, database query, and third-party API call. If a failure occurs deep within your payment processing worker, you can trace it back to the exact client interaction that initiated it.
Orchestrate Automated Diagnostic Triggers
An alert without context is simply noise. Configure your monitoring platforms to capture deep diagnostic data the moment a metric crosses an acceptable threshold.
-
Set Up Low-Latency Memory Dumps: If a service’s memory utilization spikes by more than 35% within a sixty-second window, trigger an automated heap snapshot. This allows your systems engineers to identify memory leaks caused by unclosed streams or uncollected objects before the application encounters an Out-Of-Memory (OOM) crash.
-
Preserve HTTP Request Payloads (Safely): Ensure your bug tracking systems capture the exact payload headers and request bodies that caused an API route to throw a
5XXseries error. Be sure to scrub sensitive data like plain-text passwords, credit card numbers, and personally identifiable information (PII) at the SDK level before it leaves your network.
Optimize the Developer Feedback Loop
The value of diagnostic data drops sharply the longer it takes to reach an engineer’s screen. Your bug infrastructure must route actionable insights directly into existing workflows.
-
Banish “Check the Logs” Culture: When a production issue is assigned to a developer, the tracking ticket should automatically embed deep links to the exact trace, the source code repository line, and the relevant environmental metrics.
-
Automate Regression Detection: Link your error-tracking layer directly to your version control system (e.g., GitHub, GitLab). When a novel exception appears, the system should automatically cross-reference the deployment timestamp with recent git commits, instantly identifying the specific code changes most likely responsible for the regression.
Four Common Anti-Patterns That Destroy Debugging Velocity
Even well-funded enterprise engineering teams frequently fall into habits that compromise their debugging efficiency. Identifying and correcting these anti-patterns is a critical step in streamlining your software delivery.
1. The “Print Statement” Dependency
Many developers still rely heavily on inserting console.log() or print() statements throughout their codebases to track down errors locally. While fine for basic scripts, this approach fails in distributed or high-throughput production environments.
It litters the codebase with temporary code that frequently leaks into production, adding unnecessary overhead and complicating log readability.
2. Treating Symptoms Instead of Root Causes
When under pressure to meet tight delivery deadlines, teams often apply hasty patches that mask a problem rather than solving it.
For instance, if an API connection intermittently drops due to underlying network saturation, wrapping the network call in an infinite, unthrottled retry loop might temporarily clear the error code. However, it introduces a new vulnerability—potentially creating a self-inflicted Distributed Denial of Service (DDoS) attack on your own infrastructure during peak traffic hours.
3. Relying on Siloed QA Teams
Treating quality assurance as an isolated phase that happens entirely after development is completed creates an organizational barrier.
When developers throw code over an operational wall to a QA team without sharing internal architectural context, they lengthen validation cycles. Quality must be integrated throughout the development process, backed by clear instrumentation shared by developers, QA analysts, and site reliability engineers (SREs).
4. Ignoring the Log Verbosity Tax
In an attempt to avoid missing critical details, engineering leads occasionally enable maximum log verbosity (DEBUG or TRACE modes) across entire production clusters. This approach often backfires.
The massive volume of unindexed text data overwhelms log aggregators, drives up cloud infrastructure costs, and makes finding a critical error like looking for a needle in a digital haystack.
Evaluating Your Diagnostic Infrastructure: The Capability Checklist
How resilient is your current software development lifecycle when encountering unexpected system failures? Use this diagnostic framework to assess your team’s engineering posture.
Streamlining Your Path to Production
The difference between an agile, market-disrupting product and an unstable software platform rarely comes down to raw features. It hinges on operational resilience—how quickly a system uncovers, communicates, and recovers from unexpected software defects.
By moving away from chaotic, reactive debugging and adopting an intentional, automated Endbugflow framework, your organization eliminates the operational friction that stalls releases. It transforms debugging from an unpredictable bottleneck into a structured, visible, and highly manageable component of your engineering pipeline.
The result is a clear operational advantage: faster release cycles, reduced developer fatigue, and stable software deployments that deliver consistent value to your users.
Technical Appendix: Frequently Asked Questions
How does an Endbugflow architecture differ from standard APM monitoring like New Relic or Datadog?
Application Performance Monitoring (APM) tools focus primarily on macro-level system health metrics, such as CPU utilization, overall latency, and database query runtimes.
An Endbugflow architecture operates at a micro-level, capturing the exact execution state, memory values, and code pathways of specific code failures. While an APM tool tells you that an API endpoint is running slowly, a proper bug flow system shows you the exact line of code and variable state causing the slowdown.
Will implementing deep state capture introduce noticeable performance latency to our production apps?
Modern error-handling architectures are designed to operate asynchronously and out-of-band. They rely on non-blocking event loops or lightweight background daemons to collect and transmit diagnostic data.
During normal system execution, the performance overhead is negligible (typically well under 1-2%). Deep state compilation is only triggered when an unhandled exception occurs, ensuring that application performance remains steady for your users.
How should our team handle sensitive data and compliance (GDPR/HIPAA) when capturing application states?
Security should always be handled at the collection edge. Advanced error isolation frameworks include automated data scrubbing modules.
By defining regex patterns and property blocklists at the SDK initialization stage, your application can automatically redact sensitive fields—such as credit card numbers, authorization tokens, and personal emails—before the data is transmitted to your logging or analysis dashboards.
Can this methodology be applied effectively to legacy monolithic codebases?
Yes. While containerized microservices natively benefit from structured tracing, implementing an optimized bug workflow within a monolithic legacy application often yields the highest immediate return on investment.
Introducing structured exception boundaries and correlation IDs into a legacy system helps untangle decades of opaque code execution, giving engineers clear visibility into systems that were previously black boxes.
How does optimizing our defect pipeline impact long-term technical debt?
Technical debt compounds when teams patch over structural flaws to meet short-term deadlines. By introducing automated error isolation, engineering leads gain clear data on which components fail most frequently. This telemetry allows product managers to base refactoring decisions on concrete operational data rather than intuition, ensuring engineering time is spent where it will have the greatest impact.


Leave a Reply